Maintaining good health doesn’t require complicated technology or expensive testing. Two of the most accessible metrics—Body Mass Index (BMI) and heart rate—offer valuable insight into your overall fitness, cardiovascular health, and long-term wellness.
While neither measurement tells the full story on its own, together they help you set realistic goals, track progress, and make informed decisions about your training and lifestyle.
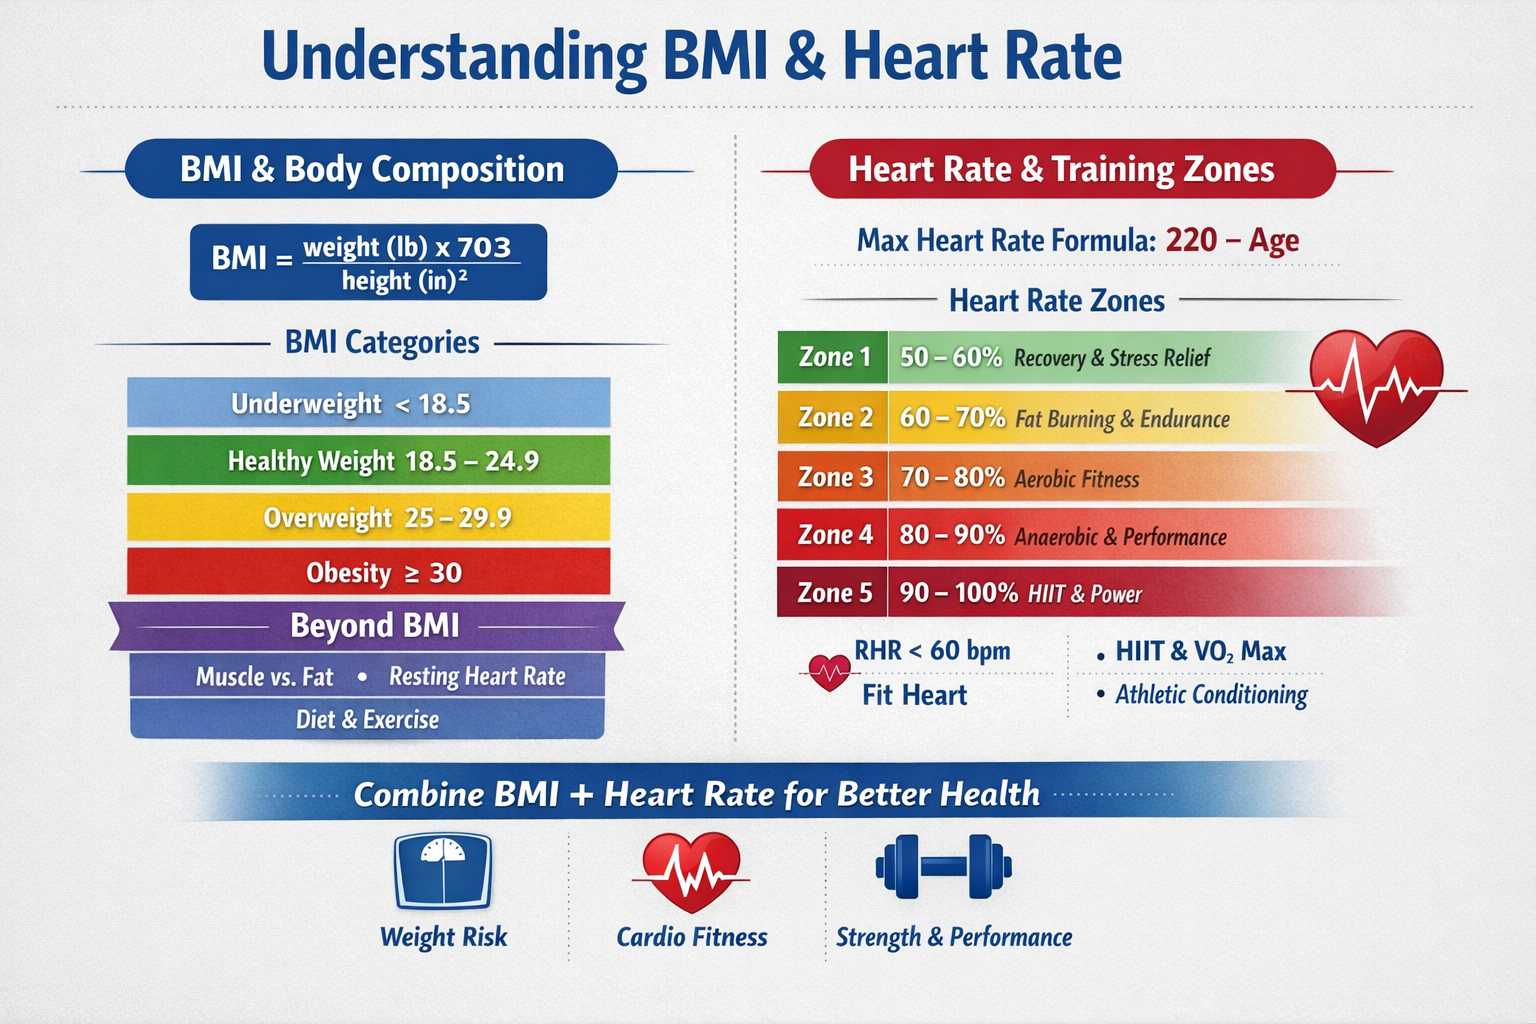
Body Mass Index (BMI): A Starting Point
BMI is a simple calculation using height and weight to estimate whether someone falls within a healthy weight range. According to the Centers for Disease Control and Prevention (CDC), it is a helpful initial marker for identifying risks for conditions like heart disease, type 2 diabetes, and certain cancers.
The BMI Formula
- Metric: BMI = weight (kg) / [height (m)]²
- Imperial: BMI = (weight (lb) * 703) / [height (in)]²
Adult BMI Categories
| Category | BMI Range |
|---|---|
| Underweight | < 18.5 |
| Healthy Weight | 18.5 – 24.9 |
| Overweight | 25 – 29.9 |
| Obesity Class I | 30 – 34.9 |
| Obesity Class II | 35 – 39.9 |
| Obesity Class III | ≥ 40 |
Note on Limitations: BMI does not distinguish between muscle mass and body fat. Athletes with high muscle mass may register as “overweight” despite having low body fat. For a complete picture, pair BMI with waist circumference and metabolic health markers.
Heart Rate: A Window Into Your Fitness
Your heart rate reflects how hard your heart is working at any moment. By tracking your resting heart rate (RHR) and calculating your maximum heart rate (MHR), you can optimize your workouts and monitor your recovery.
Understanding Your Resting Heart Rate (RHR)
Your RHR is the number of times your heart beats per minute while you are at complete rest. According to the American Heart Association, the best time to measure this is first thing in the morning before you get out of bed.
How to calculate your RHR manually:
- Place your index and middle fingers on your wrist (radial pulse) or the side of your neck (carotid pulse).
- Count the beats you feel for 30 seconds.
- Multiply that number by 2 to get your beats per minute (bpm).
What the numbers mean:
- Normal Range: 60–100 bpm for most adults.
- Highly Fit individuals: Athletes often see rates between 40–60 bpm, as their heart muscle is more efficient.
- Example: If you count 32 beats in 30 seconds, your RHR is 64 bpm, which falls within the healthy “Normal” range.
Maximum Heart Rate (MHR) by Age Group
Your estimated maximum heart rate naturally declines as you age. The most common formula, as noted by the Mayo Clinic, is 220 minus your age.
Here is how those estimates look across ten-year blocks:
| Age Group | Target Age Sample | Estimated Max HR (bpm) |
|---|---|---|
| 20 – 29 | 25 | 195 bpm |
| 30 – 39 | 35 | 185 bpm |
| 40 – 49 | 45 | 175 bpm |
| 50 – 59 | 55 | 165 bpm |
| 60 – 69 | 65 | 155 bpm |
| 70 – 79 | 75 | 145 bpm |
Heart Rate Training Zones
Understanding your zones allows you to train for specific goals, whether it’s fat loss or peak athletic performance.
| Zone | % of Max HR | Primary Benefits |
|---|---|---|
| Zone 1 | 50–60% | Recovery, gentle movement, stress reduction |
| Zone 2 | 60–70% | Fat utilization, aerobic base, metabolic health |
| Zone 3 | 70–80% | Improved endurance and aerobic capacity |
| Zone 4 | 80–90% | Speed, anaerobic threshold, performance gains |
| Zone 5 | 90–100% | HIIT, peak power, athletic conditioning |
Using These Metrics Together
When combined, BMI and heart rate provide a more complete picture of health than either one can alone:
- BMI helps identify general weight-related health risks.
- Resting Heart Rate reflects your actual cardiovascular efficiency and stress levels.
- Training Zones ensure you are working at the right intensity to reach your physical goals.
Final Takeaway: These numbers are tools, not a final verdict on your health. Use them as a compass to guide your progress, and always pair them with consistent movement, quality nutrition, and strength training.